Signal Detection
(i)Light signals are generated as particles pass through the laser beam in a fluid stream. These light signals are converted to electronic signals (voltages) by photo detectors and then assigned a channel number on a data plot. There are two types of photo detectors: photo-diodes and photo-multiplier tubes (PMTs). The photo-diode is less sensitive to light signals than the PMTs and thus is used to detect the stronger FSC signal. PMTs are used to detect the weaker signals generated by SSC and fluorescence.
(ii)A voltage pulse is created when a particle enters the laser beam and starts to scatter light or fluoresce. Once the light signals, or photons, strike one side of the PMT or the photodiode, they are converted into a proportional number of electrons that are multiplied, creating a greater electrical current. The electrical current travels to the amplifier and is converted to a voltage pulse. The highest point of the pulse occurs when the particle is in the center of the beam and the maximum amount of scatter or fluorescence is achieved. As the particle leaves the beam, the pulse comes back down to the baseline.(11.)
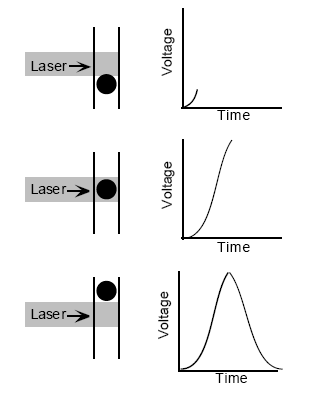
Creation of a voltage pulse(11.)
(iii)The voltage pulse is assigned a digital value by the Analog-to-Digital Converter (ADC). The ADC converts a 0–1,000 mV pulse to a digital number representing 0–1,000 mV channels. The channel number is transferred to the computer via the General Purpose In/Out (GPIO) cable. The light signal is then displayed in an appropriate position on the data plot.(11.)
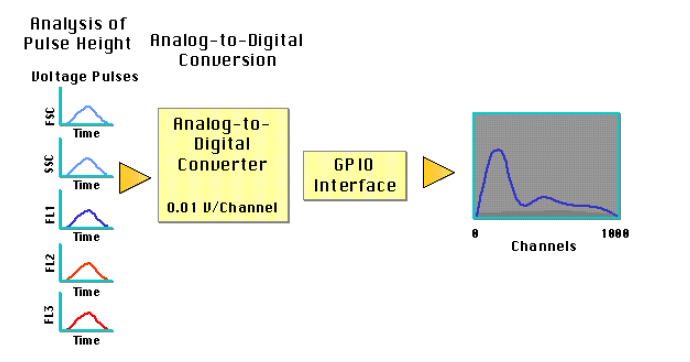
Voltage pulses converted to channel values by ADC converter(11.)
(iv) Data Collection
Once light signals have been converted to electronic pulses and then converted to channel numbers by the ADC, the data must be stored by the computer system. Flow cytometric data is stored according to a standard format, the flow cytometry standard (FCS) format, developed by the Society for Analytical Cytology.* According to the FCS standard, a data storage file includes a description of the sample acquired, the instrument on which the data was collected, the data set, and the results of data analysis.(11.)
*Data file standard for flow cytometry. Data File Standards Committee of the Society for Analytical Cytology. Cytometry.1990;11(3):323-332.
(v) Display
Two parameters can be displayed simultaneously in a plot. One parameter is displayed on the x-axis and the other parameter is displayed on the y-axis. Three-dimensional data can also be viewed where the x- and y-axes represent parameters and the z-axis displays the number of events per channel.(11.)
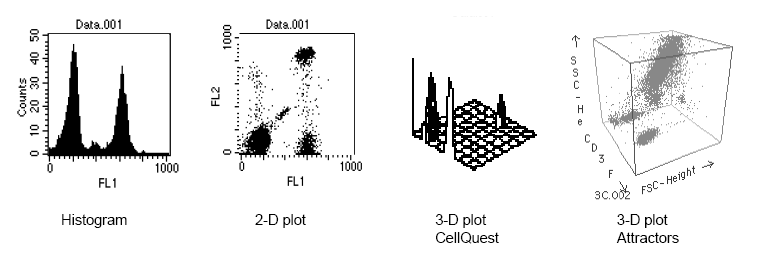
Graphic representations of flow cytometric data (11.)